
Aug. 2, 2021
There is math and gaming in building a long-term automated stock trading strategy. Some of it is quite elementary, and ignoring it could be unwise. The math sets limits, boundaries, and constraints on what you can or could do in trading stocks over the short to long term.
I use math to describe the game and see its limits, and when programming trading procedures, I try to enhance strengths and alleviate weaknesses within the confines of limited capital, limited time, limited know-how, and limited resources.
You do not have to be good at everything to make it work for you.
A very simple mathematical expression for a stock trading strategy could be: F(t) = F0 + X, where F0 is the initial trading capital at risk, and X is the accrued profits and losses from all the thousands of trades taken over that strategy's lifespan.
Adding all the trades together for i = 1, … , N gives: X = ƩiN(qi ∙ Δipi). The ongoing result of the trading strategy F(t) is always visible on the bottom line of the trading account.
After executing thousands of trades, we need a strategy to finish with a profit: X > 0. However, being positive is not enough. We need our strategy to generate enough profits to produce more than the market's long-term average rm as in: Fa(t) > F(t) = F0 ∙ (1 + rm)t.
You Need To Do More Than Average
If we do not exceed rm, then someone else could have done a better job (even if simply buying index funds). In fact, many (maybe some ~40% of market participants) with g > rmcould have done better. So, our own objective should start with: Fa(t) = F0 ∙ (1 + g)t where g = rm + α with α the excess return, an expression for the skills we can bring to the game.
Setting a trading strategy Fa(t) as a payoff matrix, we have: Xa = ƩiN(Ha ∙ ΔPa) where ΔPa is the price difference matrix from period to period for the selected stocks. Pais a subset of P, which represents the whole tradable stock universe (thousands of stocks). Unselected stocks will not impact the strategy's final results since Ʃ(0 ∙ (P - ΔPa)) = 0, meaning you cannot profit or lose on price variations from unselected stocks. However, this does not mean that P or Pa cannot influence our trade decision-making process. Our selected stocks, Pa, usually represent only a very tiny subset of the available stock universe P.
The payoff matrix will keep a detailed record, from period to period, of the profits and losses for each position taken. It gives the exact same answer as its vector series counterpart. It displays historical transaction data in a more orderly fashion, by rows (time) and columns (stocks).
Comparing Strategies
We want to compare strategies based on profits; then, the comparison is very simple: is Xa > Xb? Other portfolio characteristics could be considered. But for the most part, it remains: is strategy Xa producing more than Xb or Xc or Xz or whatever over the same time interval using the same initial capital? Was it the best we could do considering our own set of trading constraints? That is the question. Almost as a corollary, could we have done even better?
In the growth rate formula, we have: F0, g, t, and from the trading point of view: F0, N, xbar. Both formulas give the same answer since: F(t) = F0 ∙ (1 + g)t = F0 + N ∙ xbar = F0 + X. Each formula brings a different insight, one considering time as a major element while the others only look at executed trades.
We do have limited time, limited capital, limited machine powers, limited know-how, limited trading procedures, and programming skills, to which we should add the market's own constraints to overcome. The how we handle everything, from start to finish, is what will give us our own Xa.
We Should Want It Big
Evidently, we want to make it large with as little risk as possible. That does not mean with no risk at all. We should know better. We play the game. We will win some and lose some. We will have a risk of loss. The whole point is how much of it will we tolerate or endure.
Another expression for a portfolio is: Fa(t) = F0 ∙ ∏ (1 + ri), where the emphasis is put on the incremental portfolio returns. It should be evident that if ever ri = - 1, game over, you lost it all. Fortunately, this is hard to do, even if some do manage to do it anyway.
The payoff matrix can be reduced to two numbers:
Fa(t) = F0 + ƩiN(Ha ∙ ΔPa) = F0 + N ∙ xbar
where xbar is the average net profit per trade and again N is the total number of executed trades. The justification for xbar is very simple: ƩiN(Ha ∙ ΔPa) / N = xbar, it is the strategy's total generated profits divided by the total number of trades N. Any trade simulation software will give you those 2 numbers.
We can compare strategy payoff matrices. Is ƩiNa(Ha ∙ ΔPa) > ƩiNb(Hb ∙ ΔPb) > ƩiNc(Hc ∙ ΔPc)? which can be simplified to: is Xa > Xb > Xc?
The Trading Portfolio
The following chart is based on a constant portfolio outcome X = N ∙ xbar. You could make a similar chart for any value of X. The chart shows the distribution gamut of possible scenarios that could satisfy N ∙ xbar = 10,000,000 (or based on any other amount, for that matter) as an acceptable solution to this two-variable equation.
Trading Spectrum
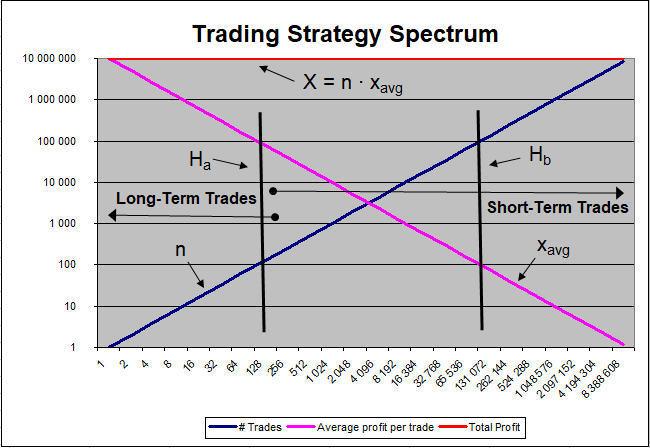
The second chart in my last March article: Basic Portfolio Math, showed the same information (N ∙ xbar), but in a more dramatic way on a semi-log scale.
In the above chart, strategies Ha and Hb have quite different makeups, even though they give the same answer:
Ha = Na ∙ xbara = 100 ∙ 100,000 = 10,000,000
Hb = Nb ∙ xbarb = 100,000 ∙ 100 = 10,000,000
Strategy Ha is more oriented towards long-term trades, while Hb goes for short-term trades with a much lower average profit per trade.
Not every trade is a winner, especially in short-term trading systems. Markets are very chaotic and randomness comes to play a major role in daily price variations. If we cannot predict with any real confidence what the price will be tomorrow, it is due to this high degree of randomness found in stock prices. There is so much market noise that it often almost totally buries underlying long-term market signals.
Win - Loss Distribution
From the above example, we can extract:
Xa = (N - λ) ∙ AW + λ ∙ AL = 10,000,000
where λ is the number of losing trades, AW is the average profit per winning trade, AL is the average loss per losing trade, with N - λ the number of winning trades.
Isolating AW and AL, we get:
AW = 10,000,000 - λ ∙ AL / (N - λ) and
AL = 10,000,000 - (N - λ) ∙ AW / λ
With λ = 0 (no losses), we have: AW = 10,000,000 / N. AL would produce a divide by zero error.
With λ = N (all losses), we should get: AL = -10,000,000 / N. AW would now get a divide by zero error, as should be expected. Therefore, one should check for the division by zero before the calculation is done. It should be noted that achieving λ = N is very hard to do. We might be better off saying that as λ tends to N, then the strategy's outcome will tend to total capital loss: λ → N implies X_a → - 10,000,000.
With N - λ = λ, or λ = N / 2, we have a 50/50 scenario where we get: λ ∙ (AW + AL) = 10,000,000. For Ha, this would give: (AW + AL) = 10,000,000 / 50 = 200,000 for the average trade. And for Hb: (AW + AL) = 10,000,000 / 50,000 = 200.
What Is Your Choice?
The question is: which is easier to realize, having $200,000 per average trade or $200? That is where short-term trading comes into play. Making, on average, about $200 per trade over the long term should be considered easy money (even if half your bets are wrong). The bigger the bet size, the easier it will be to reach that goal. This does not mean that you cannot find 100 trades over a period of 20 years that might generate an average of over $200,000 per trade. But, it does mean that a different skill set might be needed.
A $200 per trade does not require much. On a 1000-share bet, it would represent a 20-cent price move. A multitude of stocks will fluctuate by much more than 20 cents every single trading day.
Nonetheless, whatever you do trading, your final solution will fit into the above chart since, in the end, only those five numbers will matter: P0, g, t, N, and xbar.
Your job is to bring some alpha (α) to the party, which will come to make quite a difference over the long term since it will be compounding.
It should be evident from the above that increasing the number of trades or increasing the average net profit per trade or both at the same time is what needs to be done, and as a side effect, it will increase your alpha.
If you can make your strategy run longer (t + Δt), you should benefit greatly from that too.
This article is also in HTML format.
Related Articles:
Your Automated Stock Trading Portfolio
On The Use of a Rebalancer, a Flipper, and a Flusher
Making Money with no Fault of Your Own
Designing Successful Stock Trading Strategies
Winning The Automated Stock Trading Game
The In and Out Stock Trading Strategy
Aug. 2, 2021, © Guy R. Fleury. All rights reserved.